|
|
by Andreas Jabs (Andreas has left our group. So, direct enquiries to Juergen Suehnel).
Introduction
Basic principles of infrared (IR)
absorption
Fourier Transform Infrared (FTIR)
spectroscopy
Band assignments
Amide vibrations
Amino acid side chain
vibrations
Secondary structure of peptide model compounds
Beta sheet structures
Helical structures
alpha helix
310-helix
Turn structures
Secondary
structure in proteins
Deconvolution of the amide I
band
Second derivative
spectra and curve fitting
During the last years the use of Fourier Transform Infrared
spectroscopy (FTIR) to determine the structure of biologicalmacromolecules
has dramatically expanded.
The complete three-dimensional structure of a protein at
high resolution can be determined by X-ray crystallography. This
technique requires the molecule to form a well ordered
crystal which is not possible for all proteins. An
alternative to X-ray crystallography is multidimensional
nuclear magnetic resonance (NMR) spectroscopy. Using NMR
spectroscopy structures of the proteins can be determined in
solution. The interpretation of the NMR spectra of large
proteins is very complex, so its present application is
limited to small proteins (~15-25 kDa). These limitations
have led to the development of alternative methods that are
not able to generate structures at atomic resolution
but provide also structural information on proteins
(especially on secondary structure). These methods include
circular dichroism (CD) and vibrational (infrared
and RAMAN) spectroscopy.
The new technique of FTIR spectroscopy requires only
small amounts of proteins (1mM) in a variety of environments.
Therefore, high quality spectra can be obtained relatively
easy without problems of background fluorescence, light scattering and
problems related to the size of the proteins. The
omnipresent water absorption can be subtracted by mathematical
approaches. Methods are now available that can separate
subcomponents that overlap in the spectra of proteins. These
facts have made practical biological systems amenable
to studies by FTIR spectroscopy.
Basic principles of infrared (IR) absorption
We will focus on very few aspects here, because many textbooks present
excellent descriptions of the basis of IR spectroscopy (see for example
Campbell & Dwek, in Biological Spectroscoy, Benjamin Cummings,
Menlo Park, CA 1984 and Brey, Physical Chemistry and its
Biological Applications, Academic Press, New York, 1984, p.133).
IR spectroscopy is the measurement of the wavelength and intensity of
the absorption of infrared light by a sample. Infrared light is
energetic enough to excite molecular vibrations to higher energy
levels.
Electromagnetic spectrum
| frequencyrange (Hz) | wavelength range | type of radiation | type of transition |
| 1020 - 1024 | 10-12 - 10-16 m | gamma rays | nuclear |
| 1017 - 1020 | 1 nm - 1 pm | x-rays | inner electrons |
| 1015 - 1017 | 400 - 1 nm | ultraviolet light | outer electrons |
| 4.3x10¹⁴ - 7.5x10¹⁴ | 700 - 400 nm | visible light | outer electrons |
| 1012-1014 | 2.5 um - 700 nm | infrared light | vibrations |
| 108 - 1012 | 1 mm - 2.5 um | microwaves | rotations |
| 100 - 108 | 108 - 1 m | radio waves | spin flips |
The infrared spectra usually have sharp features that are characteristic of specific types of molecular vibrations, making the spectra useful for sample identification.
Table of characteristic IR bands
| X-H vibrations | bond | wavenumbers (cm-1) |
| hydroxyl | O-H | 3610-3640 |
| amines | N-H | 3300-3500 |
| aromatic rings | C-H | 3000-3100 |
| alkenes | C-H | 3020-3080 |
| alkanes | C-H | 2850-2960 |
| triple bonds | 2500-1900 | |
| double bonds | 1900-1500 | |
| deformation/heavy atoms | 1500- |
For a molecule of N atoms, 3N-6 fundamental vibrations (or normal modes) exist (3N-5 if the molecule is linear). Therefore, for the linear CO2 molecule 4 normal modes have to be expected.
Normal modes for CO2
| cm-1 | IR | RAMAN | ||
| stretching (sym.) |
|
1340 | - | + |
| stretching (asym.) |
|
2349 | + | - |
| deformation | /| /| O==C==O \| |
667 | + | - |
| deformation |
|
667 | + | - |
Fourier Transform Infrared (FTIR) spectroscopy
To use the Fourier Transform Infrared Spectroscopy, a continuum source
of light (such as a Nernst Globar) is used to produce light over a
broad range of infrared wavelengths. Light coming from this continuum
source is split into two paths using a half-silvered mirror; this light
is then reflected from two mirrors back onto the beamsplitter, where it
is recombined. One of these mirrors is fixed, and the second is
movable. If the distance from the beamsplitter to the fixed mirror is
not exactly the same as the distance from the beamsplitter to the
second mirror, then when the two beams are recombined, there will be a
small difference in the phase of the light between these two paths.
Because of the "superposition principle" constructive and
destructive interference exist for different wavelengths depending of
the relative distances of the two mirrors from the beamsplitter.
It can be shown that if the intensity of light is measured and plotted
as a function of the position of the movable mirror, the resultant
graph is the Fourier Transform of the intensity of light as a function
of wavenumber . In FTIR spectroscopy , the light is directed onto the
sample of interest, and the intensity is measured using an infrared
detector. The intensity of light striking the detector is measured as a
function of the mirror position, and this is then Fourier-transformed
to produce a plot of intensity vs. wavenumber.
As radiation source a Michelson Interferometer is used (see
the drawing below).
It is necessary to increase the sensitivity somehow, because the absorption due to one monolayer of molecules typically results in a change in intensity of only about one part in 105. For semiconductors, one way of increasing the sensitivity is to use multiple internal reflection. In this technique, the edges of the sample are polished, and the light is sent in at an angle. The light bounces around inside the sample, making about 30-50 bounces. This increases the sensitivity by about a factor of 30-50, making it possible to measure the absorption of less than one monolayer of molecules on a surface.
The peptide group, the structural repeat unit of proteins, gives up to
9 characteristic bands named amide A, B, I, II ... VII. The amide A
band (about 3500 cm-1) and amide B (about 3100 cm-1)
originate from a Fermi resonance between the first overtone of amide II
and and the N-H stretching vibration. Amide I and amide II bands are
two major bands of the protein infrared spectrum. The amide I band
(between 1600 and 1700 cm-1) is mainly associated with the
C=O stretching vibration (70-85%) and is directly related to the
backbone conformation. Amide II results from the N-H bending vibration
(40-60%) and from the C-N stretching vibration (18-40%). This band is
conformationally sensitive. Amide III and IV are very complex bands
resulting from a mixture of several coordinate displacements. The
out-of-plane motions are found in amide V, VI andVIII.
Amide A is with more than 95% due to the the N-H
stretching vibration. This mode of vibration does not depend on the
backbone conformation but is very sensitive to the strength of a
hydrogen bond. It has wavenumbers between 3225 and 3280 cm-1
for hydrogen bond lengths between 2.69 to 2.85 Å,
(Krimm
& Bandekar Adv Protein Chem 1986;38:181-364).
Amide I is the most intense absorption band in proteins.
It is primilary goverend by the stretching vibrations of the C=O
(70-85%) and C-N groups (10-20%). Its frequency is found in the range
between 1600 and 1700 cm-1. The exact band position is
determined by the backbone conformation and the hydrogen bonding
pattern.
Amide II is found in the 1510 and 1580 cm-1
region and it is more complex than amide I. Amide II derives mainly
from in-plane N-H bending (40-60% of the potential energy). The rest of
the potential energy arises from the C-N (18-40%) and the C-C (about
10%) stretching vibrations.
Amide III, V are very complex bands dependent
on the details of the force field, the nature of side chains and
hydrogen bonding. Therefore these bands are only of limited use for the
extraction of structural information.
Amino acid side chain vibrations
The presence of bands arising from amino acid side chains must be
recognized before attempting to extract structural information from the
shapes of amide I and amide II bands. The contribution of the side
chain vibrations in the region between 1800 and 1400 cm-1
(amide I and amide II region) has been thoroughly investigated by
Venyaminov & Kalnin 1990
(Biopolymers 1990;30(13-14):1243-57). Among the 20
proteinogenous amino acids only 9 (Asp, Asn, Glu, Gln, Lys, Arg, Tyr,
Phe, His) show a significant absorbance in the region discussed above.
The contribution of the different amino acid side chains
were fitted by a sum of Gaussian and Lorentzian components.
| AS | vibration | cm-1 | A0 (l/mol/cm) |
FWHH (cm-1) |
surface (x10-4 l/mol/cm) |
|
| Asp | -COO st as | pH>pK (~4.5) | 1574 | 380 | 44 | 5.5 |
| -COOH st | pH<pK (~4.5) | 1716 | 280 | 50 | 4.1 | |
| Glu | -COO st as | pH>pK (~4.4) | 1560 | 470 | 48 | 7.1 |
| -COOH st | pH<pK (~4.4) | 1712 | 220 | 56 | 3.6 | |
| Arg | -CN3H5+ st as | 1673 | 420 | 40 | 4.3 | |
| st s | 1633 | 300 | 40 | 3.6 | ||
| Lys | -NH3+ bd as | 1629 | 130 | 46 | 1.8 | |
| bd s | 1526 | 100 | 48 | 1.3 | ||
| Asn | -C=O st | 1678 | 310 | 32 | 2.7 | |
| -NH2 bd | 1622 | 160 | 44 | 2.5 | ||
| Gln | -C=O st | 1670 | 360 | 32 | 3.1 | |
| -NH2 bd | 1610 | 220 | 44 | 3.5 | ||
| Tyr | ring-OH | pH<pK (~10) | 1518 | 430 | 8 | 1.0 |
| ring-O | pH>pK (~10) | 1602 | 160 | 14 | 0.7 | |
| 1498 | 700 | 10 | 2.5 | |||
| His | ring | 1596 | 70 | 14 | 0.3 | |
| Phe | ring | 1494 | 80 | 6 | 0.2 | |
| terminal | ||||||
| -COO st as | 1598 | 240 | 47 | 3.5 | ||
| -COOH st | 1740 | 170 | 50 | 2.1 | ||
| -NH3+ bd as | 1631 | 210 | 54 | 3.8 | ||
| bd s | 1515 | 200 | 60 | 4.3 | ||
| -NH2 bd | 1560 | 450 | 46 | 7.5 |
frequency, absorbance at the maximum (Ao), full width at half height
(FWHH), surface of Gaussian band
st=stretching vibration
bd=bending
s=symetrical
as=asymetrical
(according to Venyaminov & Kalnin,
Biopolymers 1990;30(13-14):1243-57)
Secondary structure of peptide model compounds
A large number of synthetic polypeptides has been used for the characterization of infrared spectra for proteins with a defined secondary structure content. For example, polylysine may adopt both beta-sheet or alpha-helical structures in dependence on temperature and pH of the solution. Experimental and theoretical work on a large number of synthetic polypeptides has provided insights into the variability of the frequencies for particular secondary structure conformations (Krimm & Bandekar, Adv Protein Chem 1986;38:181-364 )
Beta sheet structures
(beta
strand)
The frequencies of the main absorption bands from synthetic
polypeptides adopting an antiparallel chain structure have been
compiled by Chirgadze & Nevskaya (Biopolymers
1976 Apr;15(4):637-48). From these data it this follows, that the
amide I absorption is primarily determined by the backbone conformation
and independent of the amino acid sequence, its hydrophilic or
hydrophobic properties and charge. The average frequency of the main
component is about 1629 cm-1 with a minimum of 1615 cm-1
and a maximum of 1637 cm-1. The average value for the
second frequency is 1696 cm-1 (lowest value 1685 cm-1).
The parallel beta sheet structure that is not common in synthetic
polypeptides leads to an amide I abosrption near 1640 cm-1
Helical structures
The alpha-helix:
For alpha-helical structures the mean frequency was found to be 1652
cm-1 for the amide I and 1548 cm-1 for the amid II absorptions
(Chirgadze & Nevskaya,
Biopolymers 1976 Apr;15(4):637-48). The half width of
the alpha-helix band depends on the stability of the helix.
For the most stable helices, the half-width of about 15 cm-1
corresponds to a helix-coil transition free energy of more than 300
cal/mole. Other helices display half-widths of 38 cm-1 and
helix-coil transition free energies of about 90 cal/mole.
The 310-helix
differs from the alpha-helix in that the internal hydrogen
bonding occurs between residues i and i+3 instead of i and i+4 in alpha
helices.
Turn structures
The beta turn structure involves 4 amino acid residues which form a loop so that the two chain segments separated by the turn adopt an antiparallel orientation and form an i to i+3 hydrogen bond. A number of turn structures have been identified from protein structures: type I (42%, non-helical), type II (15%, non-helical, requires Gly in position 3) and type III (18%, corresponds to one turn of 310 helix). Assignment of beta turns by means of a normal mode analysis for insulin demonstrates a strong overlapping of the different types of beta turns with the alpha-helical absorption (Krimm & Bandekar, Adv Protein Chem 1986;38:181-364). However, an absorption near 1680 cm-1 is now clearly assigned to beta turns.
Secondary
structure in proteins
The shape of the amide I band of globular proteins is characteristic of their secondary structure. With a publication by Byler & Susi (Biopolymers 1986 Mar;25(3):469-87 ) the determination of secondary structures in proteins from FTIR spectra actually started. This had become possible by the availability of high signal-to-noise ratio digitalised spectra obtained by the FTIR spectrometer and by the access to computers and software able to perform many operations on the spectra in a short time.
Deconvolution of the amide I band
The concept of Fourier self deconvolution is based on the assumption,
that a spectrum of single bands (each narrow band is characteristic for
a secondary structure) is broadened in the liquid or solid state.
Therefore, the bands overlap and can not be distinguished in the amide
envelope. A curve fitting procedure can be applied to estimate
quantitatively the area of each component representing a type of
secondary structure. In the pioneering work by Susi & Byler
(Methods Enzymol 1986;130:290-311) the amide I was
deconvoluted with a Lorentzian line shape function and a resolution
enhancement factor of 2.4 was applied. The deconvoluted spectrum was
fitted with Gaussian band shapes by an iterative curve fitting
procedure. The results are in good agreement with with the secondary
structure information obtained from X-ray crystallographic structures
of the proteins under study.
| a) | b) | ||||||
| sec. structure | Mean (cm-1) | RMS (cm-1) | Max (cm-1) | Mean (cm-1) | RMS (cm-1) | Max (cm-1) | Region (cm-1) |
| turns | 1694 | 1.7 | 2 | - | - | - | |
| 1688 | 1.1 | 2 | - | - | - | ||
| 1683 | 1.5 | 2 | 1678 | 2.1 | 5 | 1682-1662 | |
| 1670 | 1.4 | 2 | 1670 | 2.9 | 5 | ||
| 1663 | 2.2 | 4 | 1664 | 1.0 | 3 | ||
| alpha-helix | 1654 | 1.5 | 3 | 1656 | 1.5 | 3 | |
| 1648 | 1.6 | 3 | 1662-1645 | ||||
| unordered | 1645 | 1.6 | 4 | 1641 | 2.0 | 3 | 1645-1637 |
| beta sheet | 1624 | 2.4 | 4 | 1624 | 2.5 | 5 | |
| 1631 | 2.5 | 3 | 1633 | 2.1 | 4 | 1637-1613 | |
| 1637 | 1.4 | 3 | - | - | - | ||
| 1675 | 2.6 | 4 | 1685 | 2.1 | 4 | 1689-1682 |
a) Proteins in solution (Susi & Byler, Methods Enzymol 1986;130:290-311) or b) as hydrated film on an ATR plate (Goormaghtigh et al., Eur J Biochem 1990 Oct 24;193(2):409-20). The mean frequency of each component is reported together with the root mean square (RMS) and the maximum deviation (Max).
Second derivative spectra and curve fitting
The spectra discussed in this chapter were collected with a IFS
66 spectrometer (Fa. BRUKER).
The protein spectra are detected at a resolution of 1.5 cm-1.
The native proteins were solved in water (pH 6.5). All proteins were
denatured by dissolving in water and heating up to 95 oC
for 50 minutes. The aqueous protein solutions to be lyophilized were
frozen in liquid nitrogen. The lyophilized proteins were measured at
1.5 mg protein per 300 mg of KBr. After homogenizing the lyophilized
protein and KBr were pressed into pellets by using a 12-ton hydraulic
press.
The author thanks Wilfried Hartmann and Gisela Werner from the Bruker
Saxonia Analytik GmbH for the access to the spectrometer facilities
and for the excellent technical assistance.
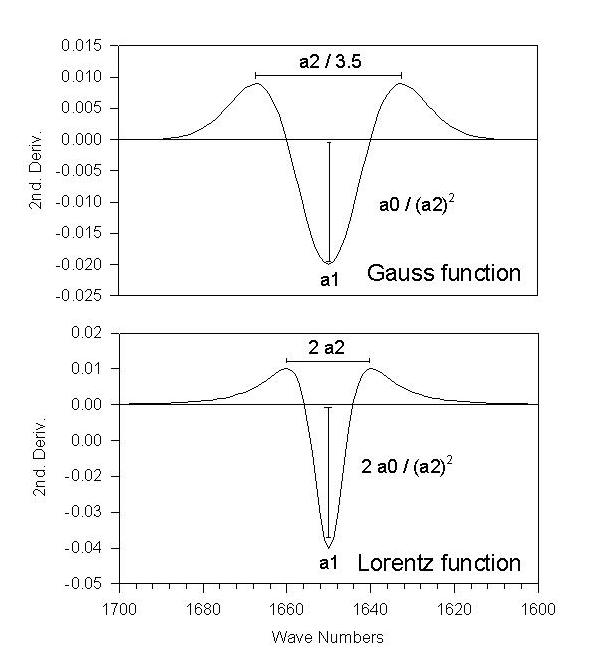
The resolution-enhanced spectra allow the identification of the various
secondary structures occurring in the protein. Most of the peak
positions were easily found in the second derivative spectra. An
example for the second derivative of a Gaussian and a Lorenztian curve
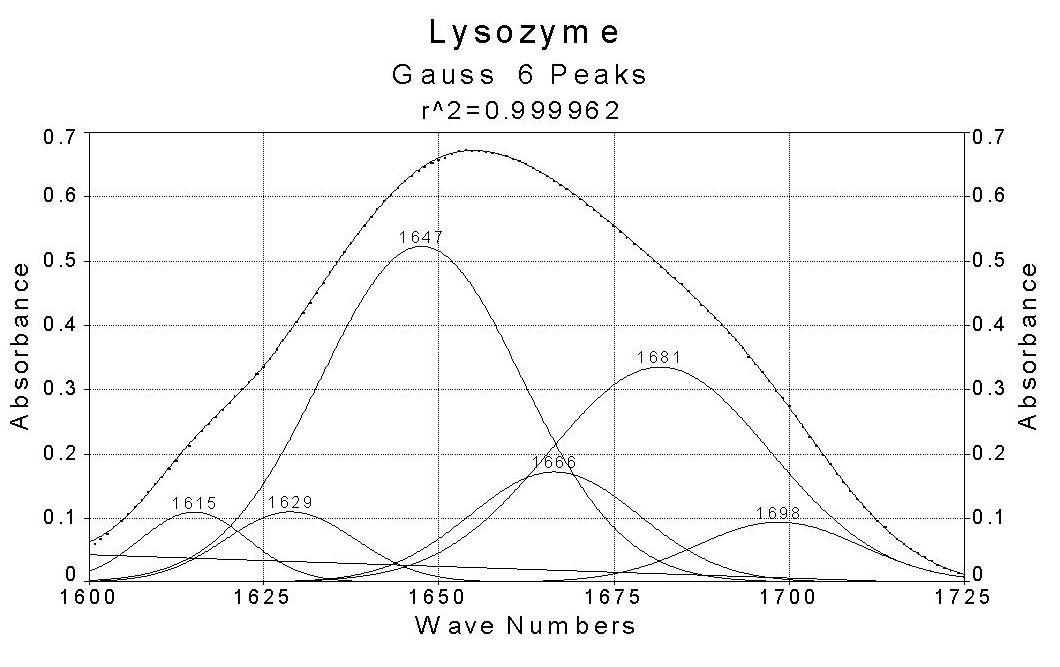
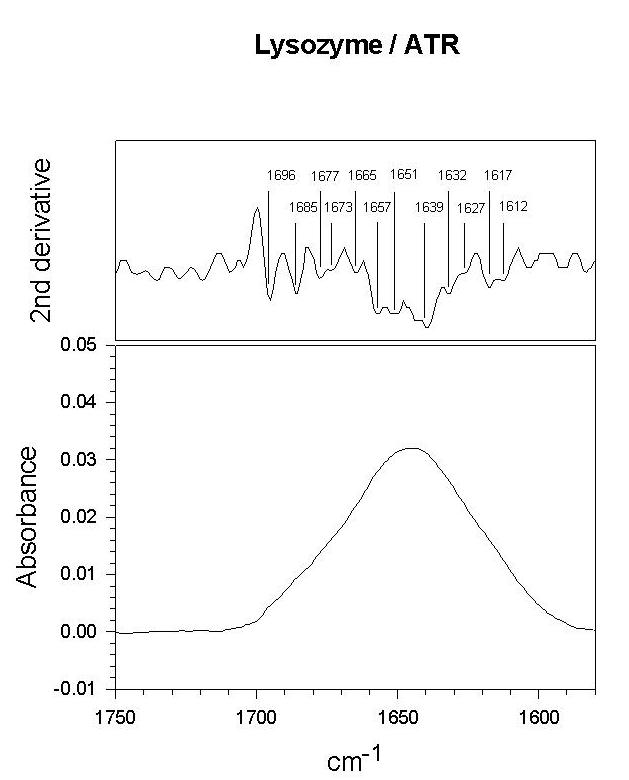
is shown in this Figure. Using only the peak
positions from the second derivative spectrum for lysozyme (Figure), 12 different peaks were found in
the amide I region. In addition to the frequency position (a1)
information on the width (a2) and the maximum absorption intensity (a0)
of the individual bands can be obtained from the second derivative.
However, an accurate determination of the bandwidth from the maxima in
the second derivative spectrum is complicated due to the presence of
neighboring peaks. Despite this inaccuracy, the obtained parameters can
successfully be used as input parameters for a fitting procedure.
However, the peak positions were sometimes difficult to distinguish.
This difficulty arose when either one of the two peaks showed up as a
shoulder instead of a separate peak in the second derivative spectrum.
In general, the bandwidths of the structural components are in the
range of 8-28 cm-1. In some second derivative spectra, peaks
appeared with very small band widths. In these cases it was assumed,
that small fluctuations originated from noise. Using the additional
parameters from the second derivative spectra for lysozyme (Figure), the resulting peak number is 6. The
Table compares the secondary structure contents for different
techniques with results from X-ray crystallography.
| X-ray | FTIR | ||||
| a) | STRIDE b) | a1 c) | a1 | a0,a1,a2 | |
| helix | 45 | 46 | 56 | 41 | 42 |
| beta-sheet | 19 | 17 | 27 | 29 | 16 |
| turn | 23 | 28 | 16 | 16 | 36 |
| random | 13 | 9 | 1 | 14 | 6 |
a) M.
Levitt et al. J Mol Biol 1977 Aug 5;114(2):181-239
b) F. Eisenhaber et al. 1993 &1994
c) S.
Luo et al. Anal Biochem 1994 Jan;216(1):67-76
Using the parameters a0, a1 and a2, the secondary structure content
derived from FTIR spectra is in agreement with X-ray crystallography
data. The structural components were quantified by the integrated areas
of the respective peaks. This implies that the effective absorptivities
can be assumed to be equal. This assumption was validatedby
Byler & Susi (Biopolymers
1986 Mar;25(3):469-87).
Circular Dichroism (CD) spectroscopy is a well established technique
for the analysis of secondary structure of proteins in aqueous
solution. This technique seems to be less reliable for the study of
aggregated proteins, inclusion bodys or membrane bound proteins due to
light scattering problems associated with large membrane fragments or
aggregates. FTIR spectroscopy has proved to be a powerful tool for
investigations on proteins discussed above.
| LDH | FAB | CSC | ||||
| Xray | FTIR | Xray | FTIR | Xray | FTIR | |
| helix | 43 | 49/25 | 49 | 19/6 | 64 | 64/4 |
| beta-sheet | 19 | 21/15 | 14 | 39/18 | 1 | 15/14 |
| turn | 30 | 27/15 | 28 | 33/18 | 23 | 19/31 |
| random | 8 | 3/42 | 9 | 9/39 | 1 | 2/49 |
FTIR native/denatured (thermally denatured), all data in %
In addition to the examples decribed above we have recorded the FTIR spectra in the amide I region of LDH (lactate dehydrogenase), FAB (fab fragment, mouse antibody), CSC (citrate synthase), LYS (lysozyme) according to the procedure described above. The second derivatives of all spectra were calculated using the spectrometer software OPUS. Before starting the fitting procedure, the obtained depths of the minima in the second derivative spectrum and, subsequently, the calculated maximum intensities were corrected for the interference of all neighboring peaks. The curve fitting is performed by stepwise iterative adjustment towards a minimum root-mean-square error of the different parameters determining the shape and position of the absorption peaks.
spectra of native proteins (click to enlarge)
 LYS
LYS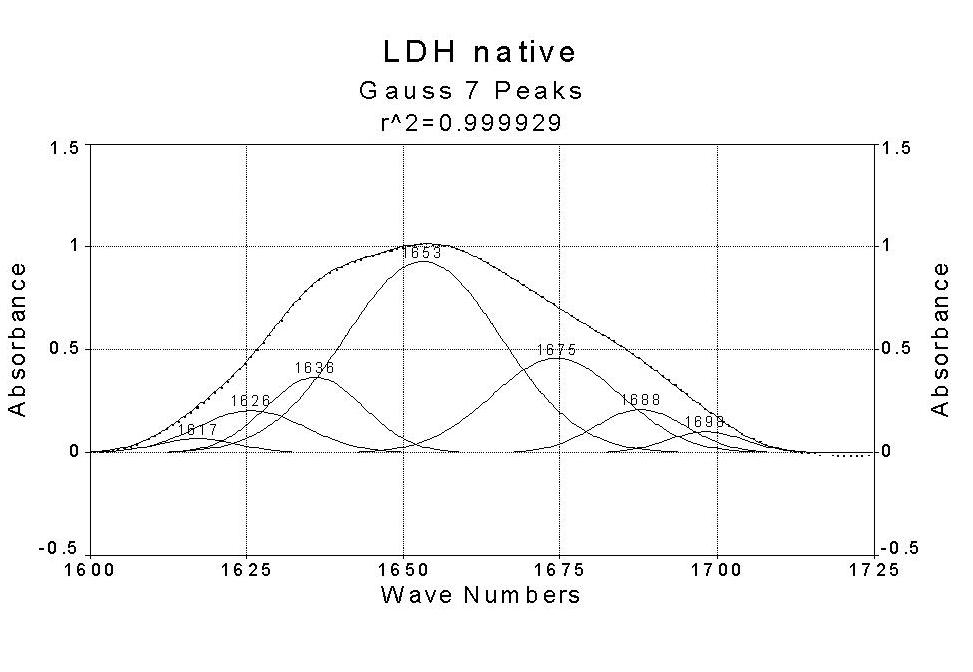 LDH
LDH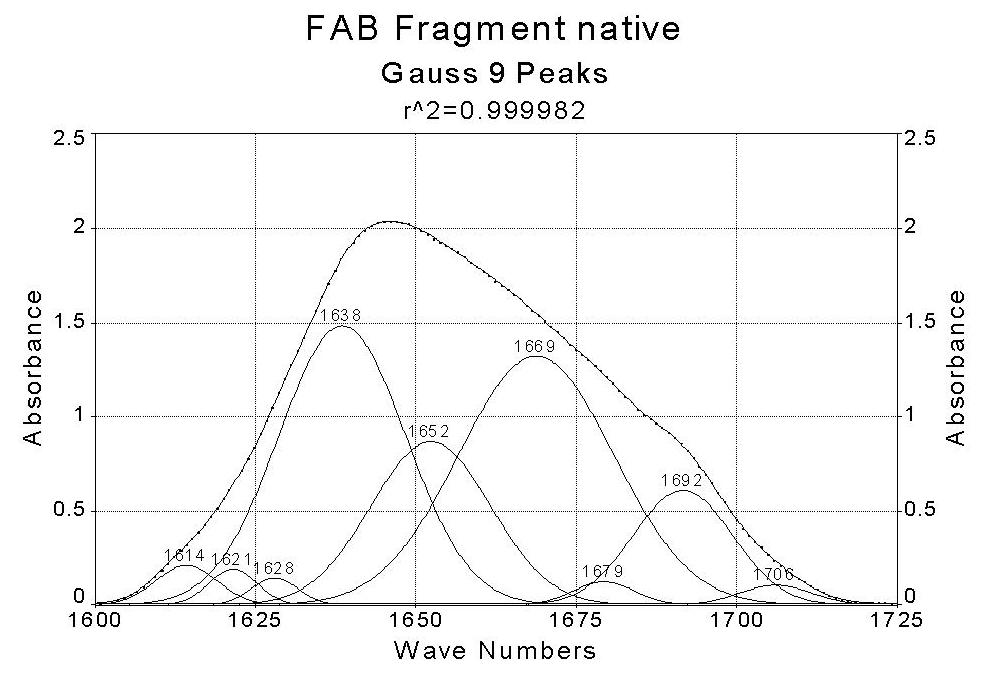 FAB
FAB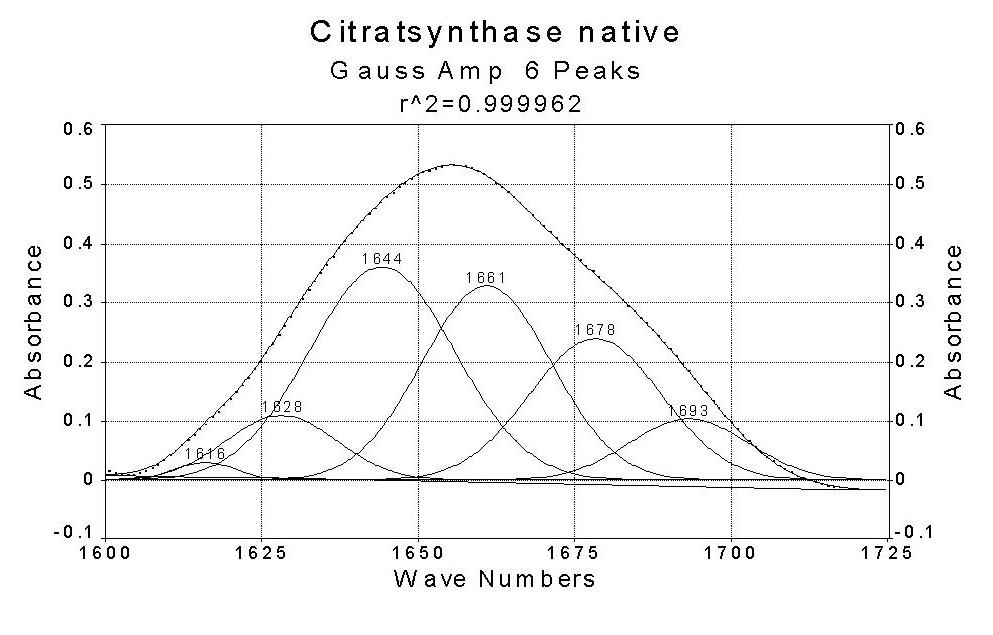 CSC
CSC
The data reveal that the amide I band for all proteins consists of six or seven major components which were found in all spectra. The helix content derived from the amide I region for lysozyme, lactate dehydrogenase and citrate synthase is in agreement with the data from X-ray crystallography. The helix content in the FAB fragment of mouse antibody is too low, the beta-sheet content too high. Visual inspection of the amide I envelope of the native and thermally denatured states revealed a striking difference in the band shapes. For the native state, the band is fairly asymmetric and has a peak maximum around 1650 cm-1 which corresponds to alpha-helical structure. In contrast, the denatured proteins show an additional maximum between 1620 and 1640 cm-1, indicative of the predominance of beta-sheet and unordered structures.
spectra of thermally denatured proteins (click to enlarge)
 LYS
LYS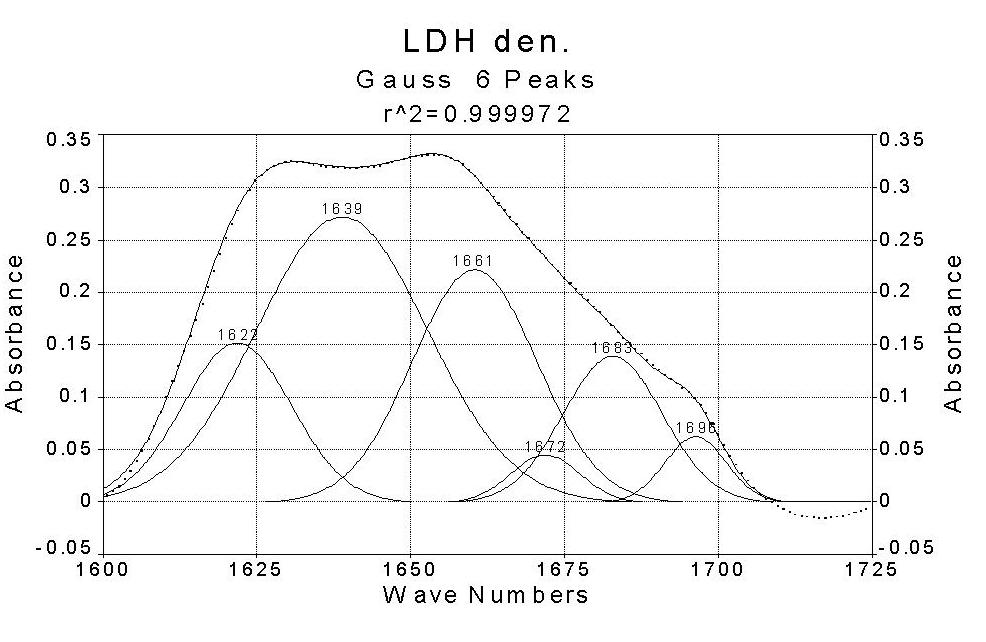 LDH
LDH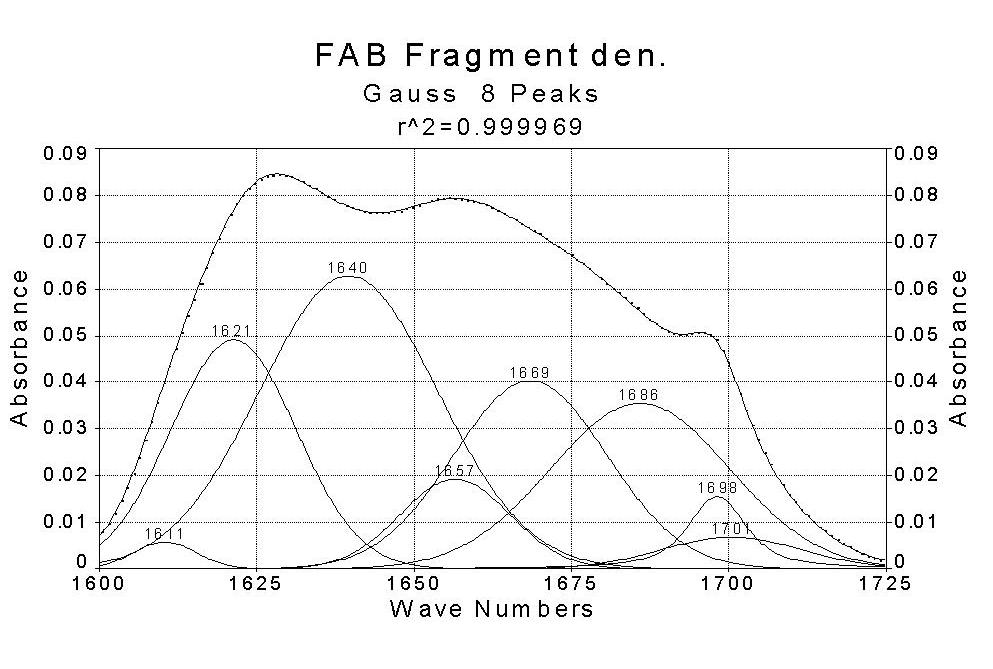 FAB
FAB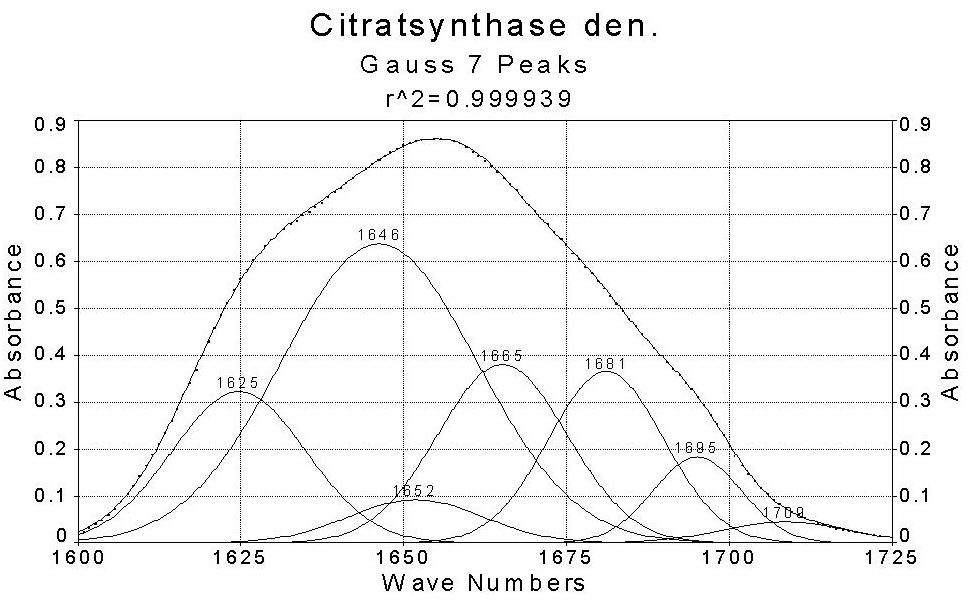 CSC
CSC
In the following afew papers applying FTIR spectroscopy to denatured proteins and inclusion bodies are compiled
in denatured proteins
Schweers
et al. J Biol Chem 1994 Sep 30;269(39):24290-7 ,
Sancho
et al. Biochemistry 1995 Jan 24;34(3):1064-9 ,
Menendez
et al. Eur J Biochem 1995 Dec 15;234(3):887-96 ,
Boye
et al. J Dairy Res 1996 Feb;63(1):97-109 ,
Xie
et al. Arch Biochem Biophys 1996 Apr 1;328(1):122-8 ,
Bramanti
et al. Biopolymers 1996 May;38(5):639-53 , Biopolymers
1997 Aug;42(2):227-37 ,
Jiang
et al. Biochim Biophys Acta 1996 May 23;1294(2):121-8 ,
Lee
et al. Biomaterials 1996 Aug;17(16):1599-608 ,
Azuaga
et al. Biochemistry 1996 Dec 17;35(50):16328-35 ,
Narhi
et al. J Pept Res 1997 Oct;50(4):300-9 ,
Magdaleno
et al. FEBS Lett 1997 Dec 29;420(2-3):179-85
and inclusion bodys
Chiu
et al. Science 1998 Feb 20;279(5354):1190-3 ,
Tablin
et al. J Cell Physiol 1996 Aug;168(2):305-13 ,
Oberg
et al. Biochemistry 1994 Mar 8;33(9):2628-34.
More recent reviews:
|
|
|
|
Beutenbergstraße 11 D-07745 Jena • Germany |
Phone: +49 3641 65-6000 Fax: +49 3641 65-6351 |
E-mail: info@leibniz-fli.de www.leibniz-fli.de |
Data Privacy Imprint |
 |